DCF77 vs. GPS - Kasper Pedersen <dcf77pg1@taur.dk>30 Dec. 2006
This is the output of a 77,5kHz I/Q integrate-and-dump receiver time stamped against GPS.
Blue plot is received signal strength, green plot is phase relative to GPS time. A positive value means that DCF arrives before GPS.
All plots are unfiltered; The thick trace is due to a combination of the sawtooth on the GPS output (old SiRF1) and the resolution on the PPS input (50 ns).
I did this plot to determine the apparent Doppler shift that occurs when the sun rises and strikes the ionosphere, so I could construct a proper filter for my DCF-DO. As a side benefit, I now have data that show just how bad 'computer grade' AT cut crystals are, even when ovenized.
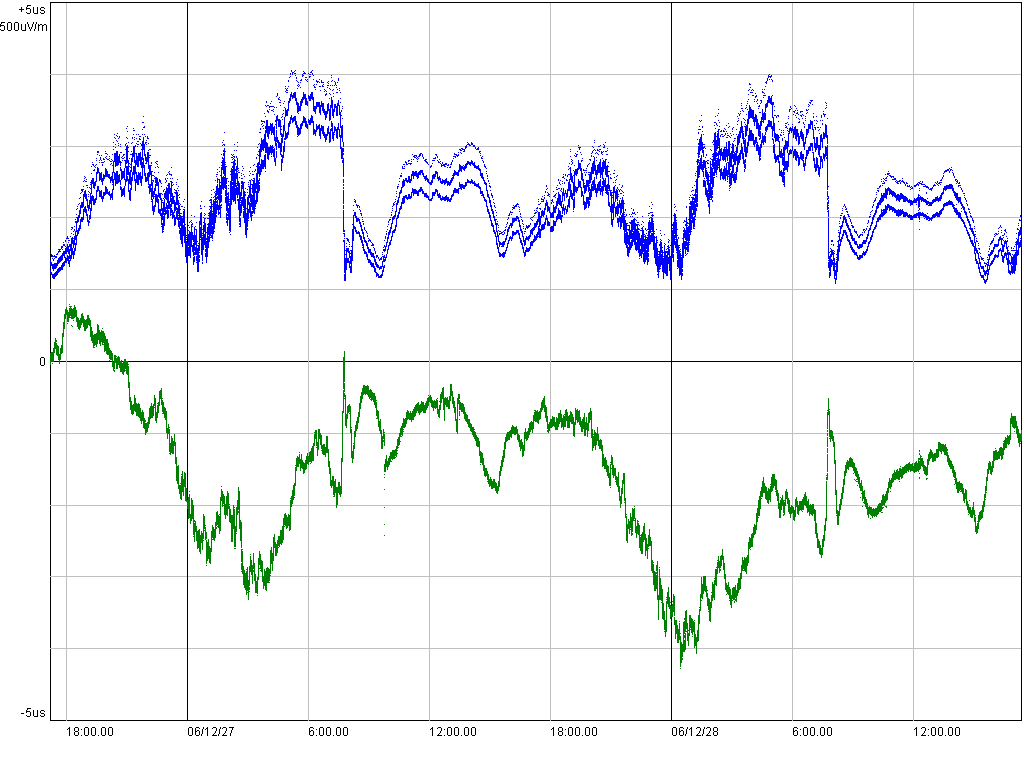
Two days (26-27-28 Dec. 2006). The amplitude trace shows three distinct values: minute marker (no reduction), 100ms, and 200ms reduction..
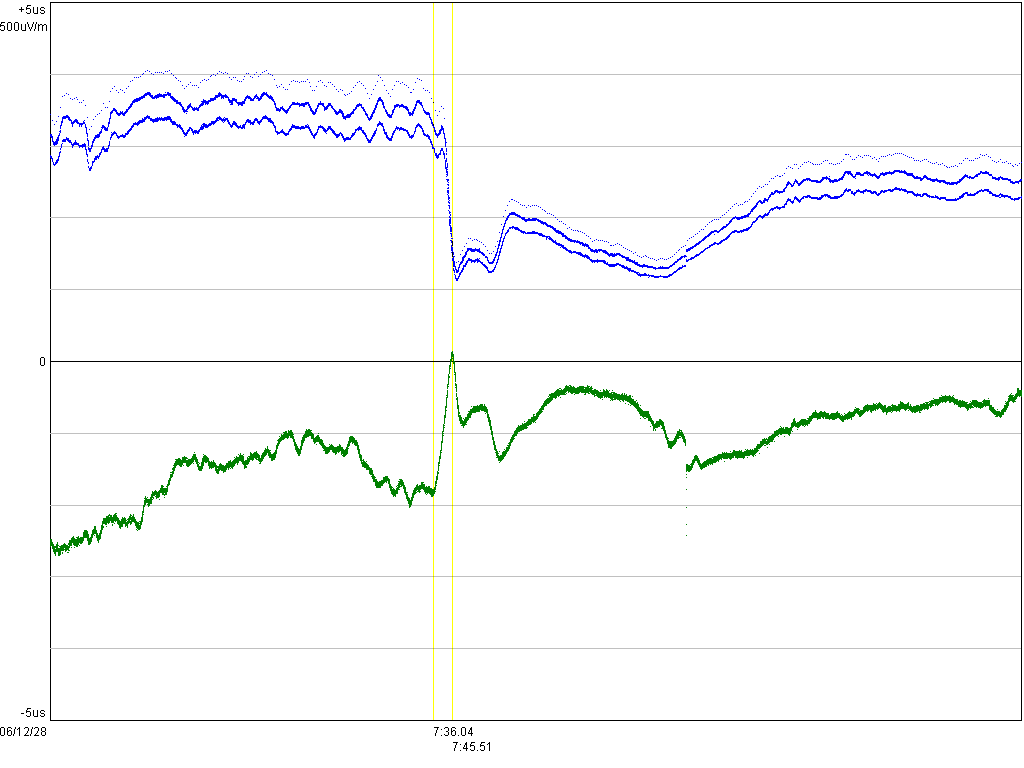
The first dawn; That's 2 µs in 10 minutes, 3.3*10^-9 frequency error, 258 µHz high:
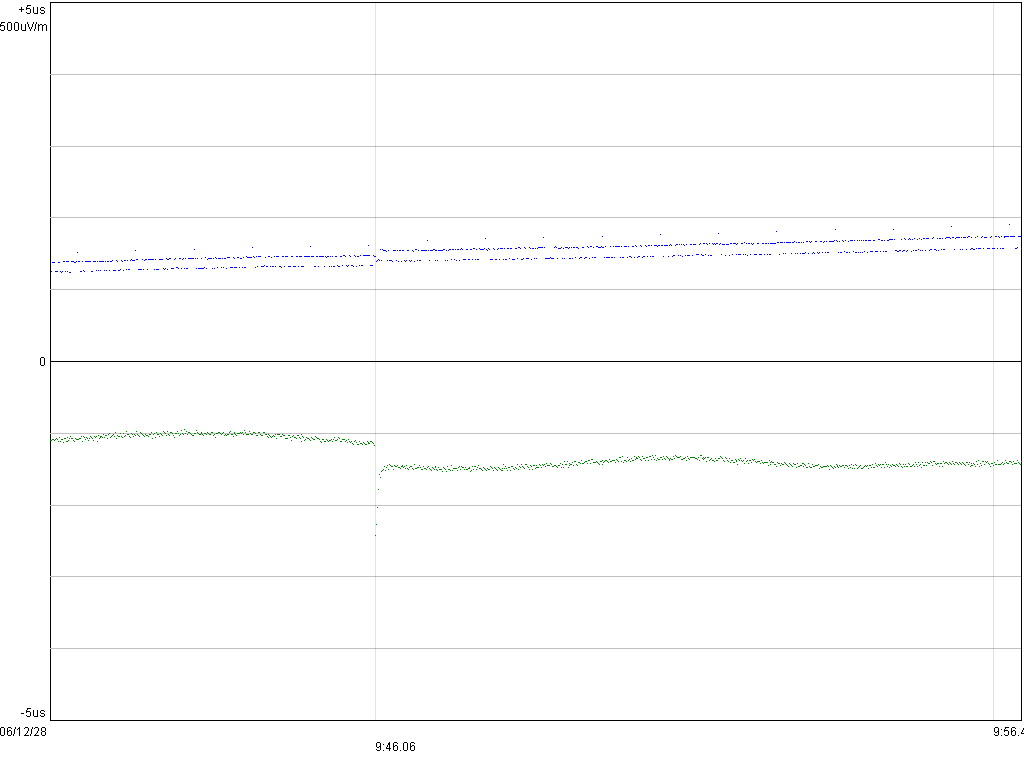
There's
an odd phase and amplitude jump in the above picture, and it's not a
receiver artefact, at 9:46:06. Notice the 5 samples after the event:
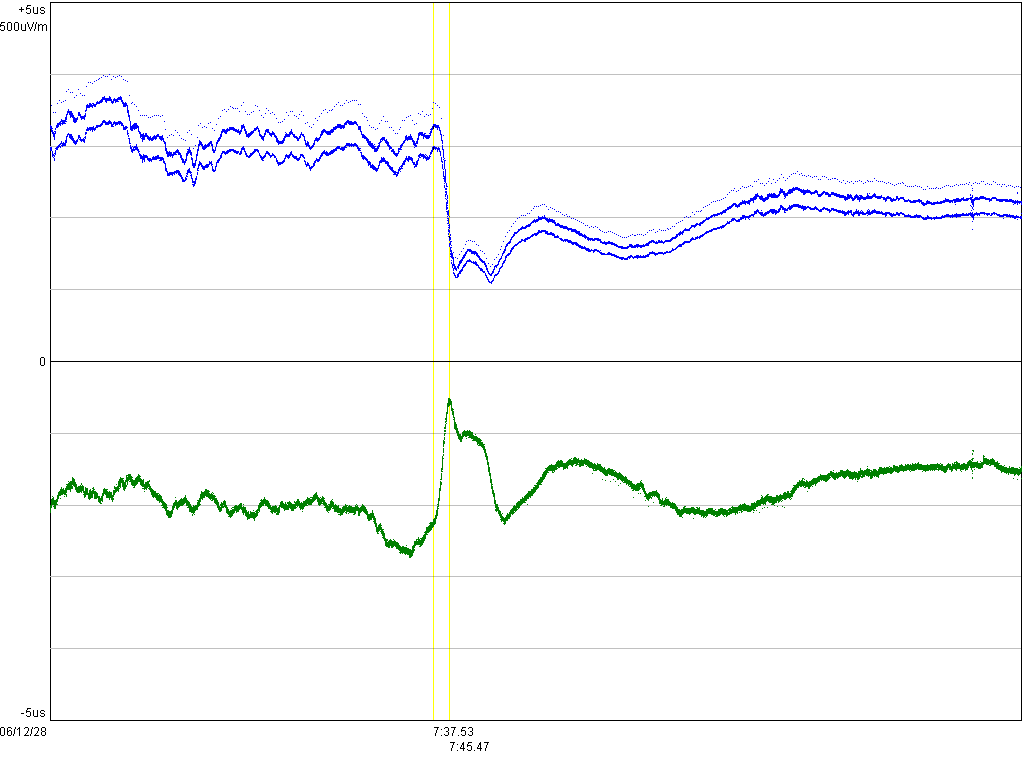
Second
dawn, similar drop in amplitude and lead in phase:
And
the best plot of them all: Here is a
10k pixels wide plot where you can see all the little perturbations
And if you want to poke at the raw data, they are here: zipped raw data (I/Q ADC values and PPS pulse time stamp)
Update 30/12 2006: Now four days. Just after 1300 29 Dec 2006 I switched the receiver into fast phase acquisition mode (meant for coarse adjustment of the OCXO after power up). The spike around 1600 on 29 Dec. is the GPS losing lock, it doesn't have the best view of the sky. And, there's a 1.2µs phase jump.
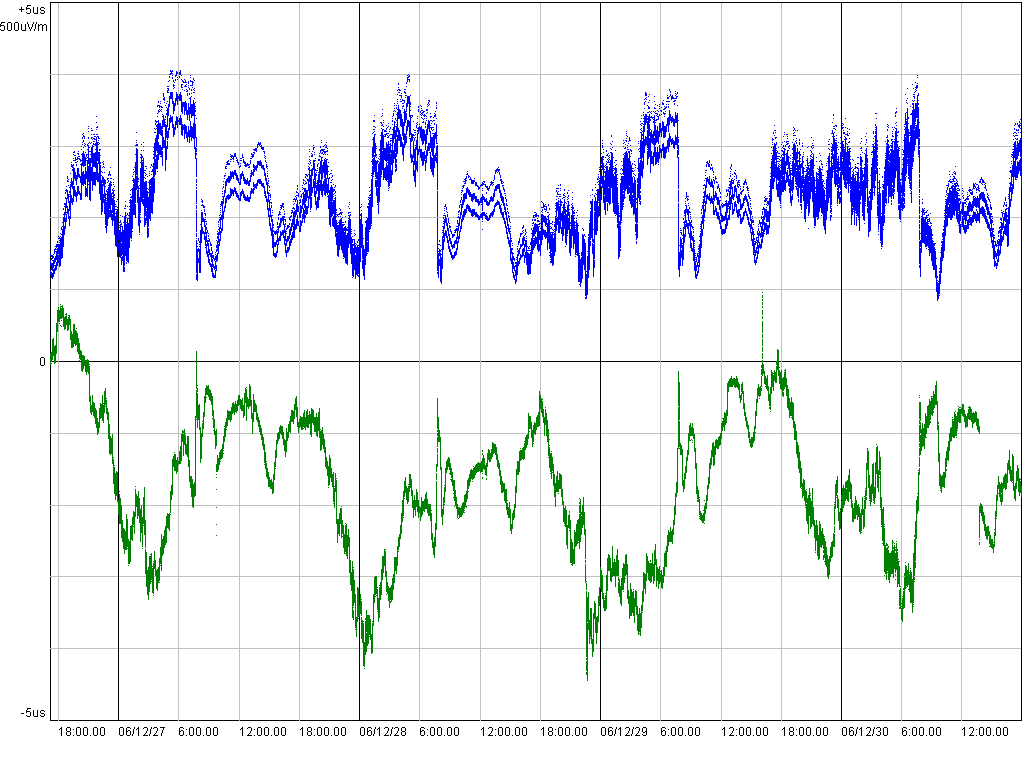
Here's a 19k pixels wide plot that also includes the VCO voltage. http://n1.taur.dk/dcf/dcf-19kpixels-annotated.png And the raw data is here: http://n1.taur.dk/dcf/clocktrack2.zip
The plot consists of the previous 2.5 days, followed by two minute's lack of data while I switched the receiver into UI mode and made the change, and then back to data gathering mode. The VCO voltage looks like a noise signal since, in fast acquisition mode, the phase error is fed directly to the VCO, and the integrator only works for errors greater than 1µs.
The phase skip magnified, it's really two instantaneous phase changes. There is also an amplitude discontinuity:
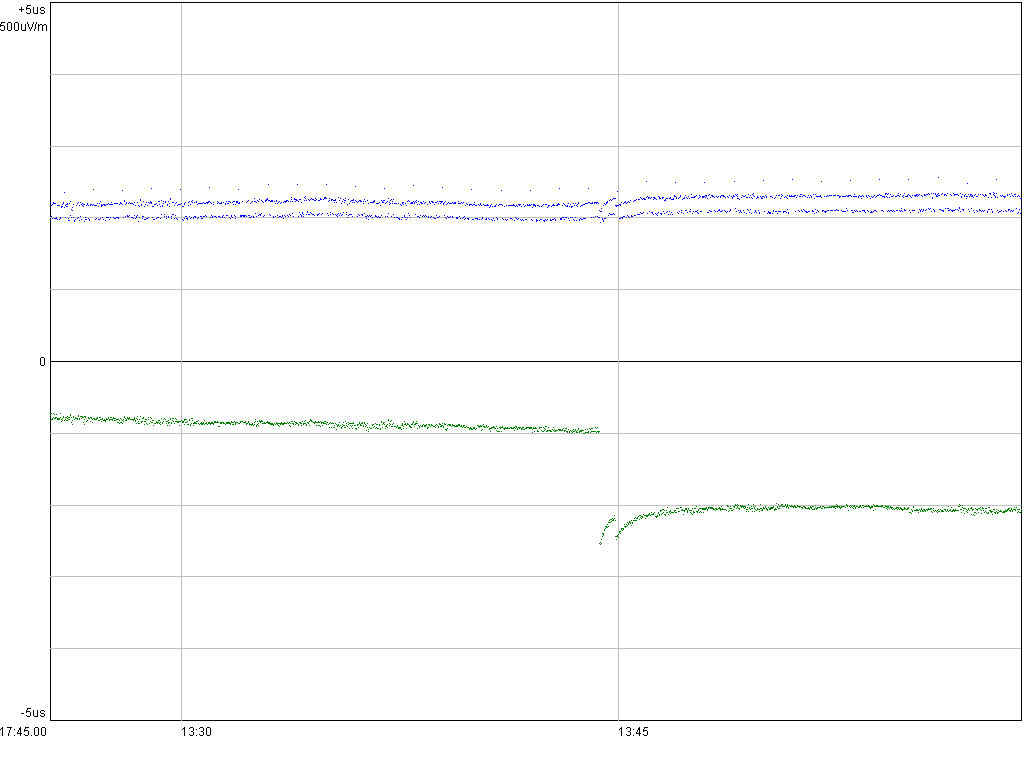
These
jumps are interesting in that they don't appear to have intermediate
values: If they happened halfway through the integration interval
there would be a sample halfway across the gap. None of the jumps
show such samples. And the amplitude wiggles too, something I
wouldn't expect if this was a controlled phase adjustment.
The slew rate after the jump is 400 ns / 30s = 13 ns/s = 0,37 degrees/second, not enough for the integrator to cause the drop in amplitude reading. The slew rate corresponds to a frequency error of 5 ppm(!).